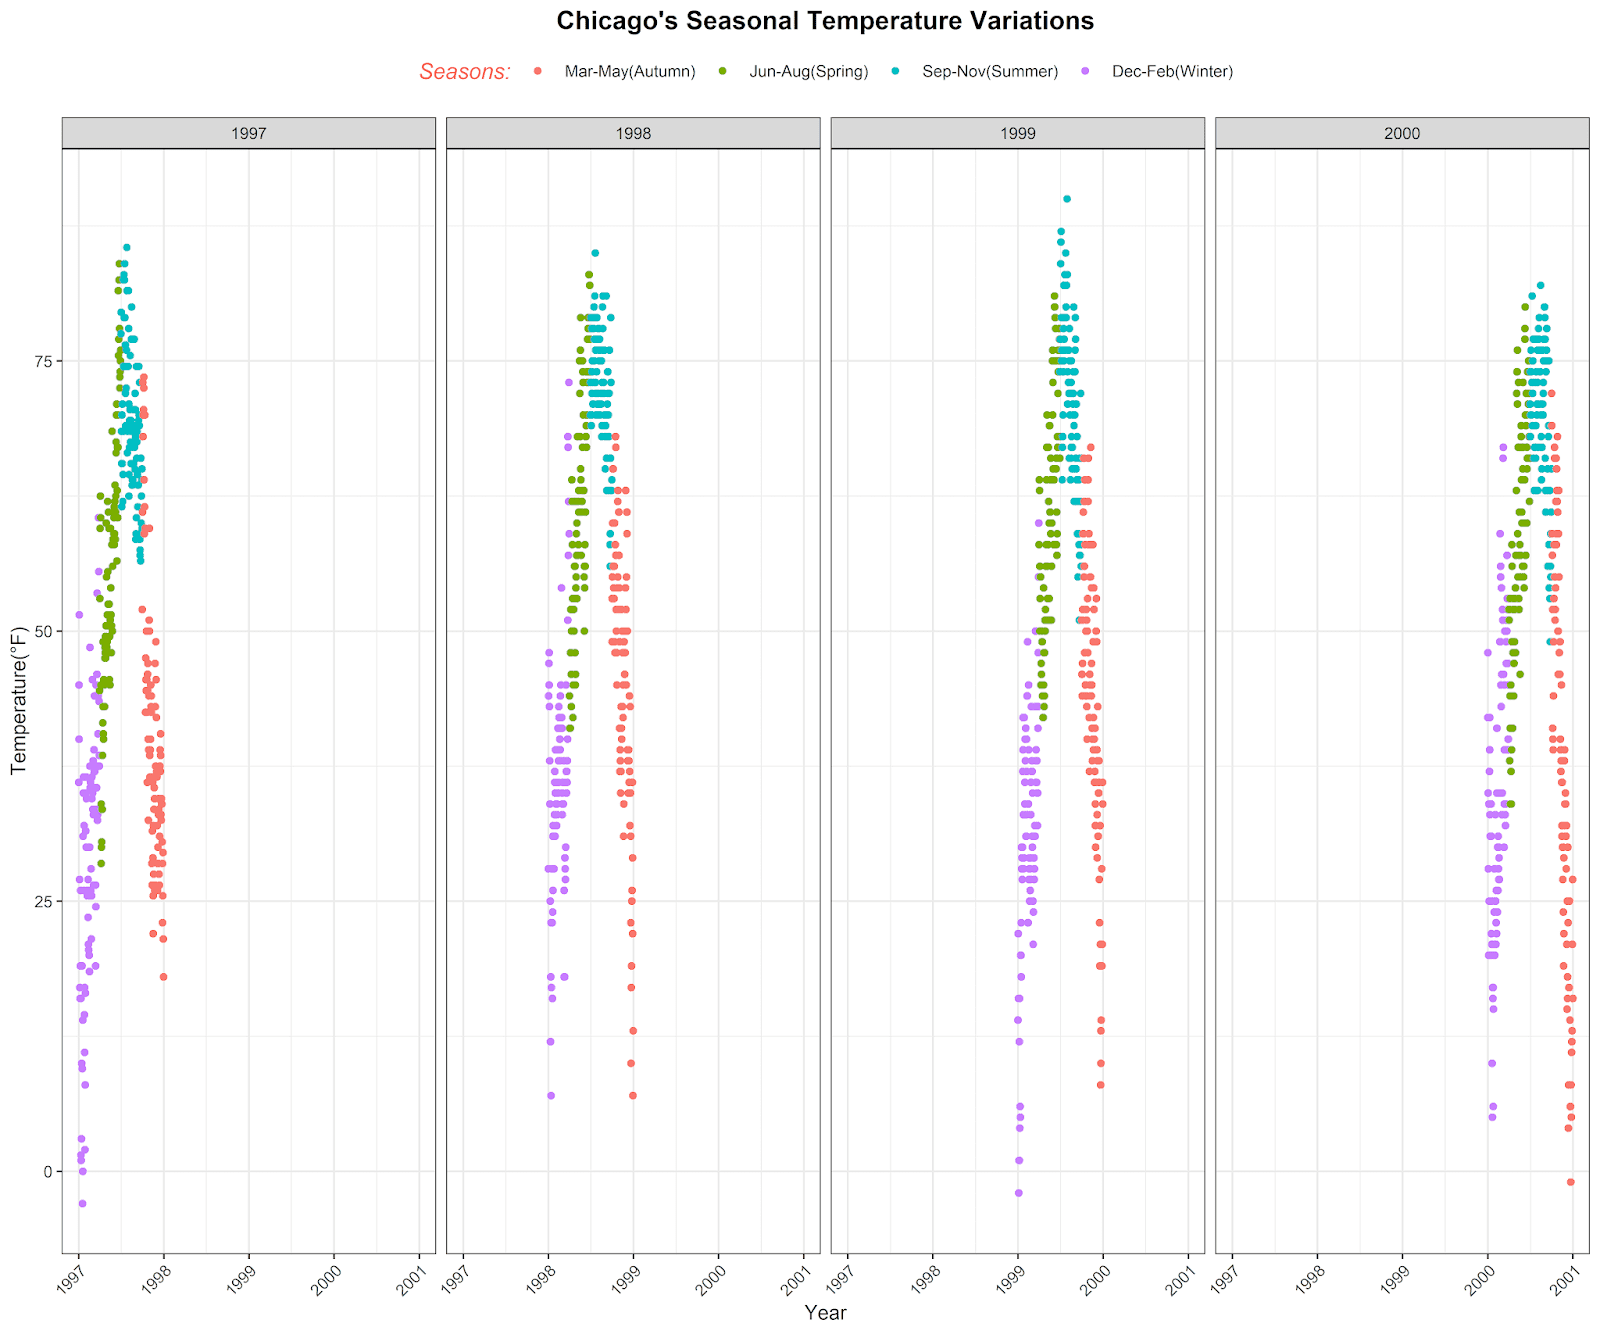
Hello! For this assignment I picked the data from NeonScience website. In this data, we have a weather record of Chicago where seasonal changes are given. I have examined this seasonal change between each season using scatter plot. I have split the graph into all of the recorded year, and have applied colors to each season for better visualization. Here is my code, please take a look at it:
And here is the output from this code chunk:
And here is the output from this code chunk:
In order to produce this graph, I first read the .csv file with readr function. Beauty of this function is that it automatically converts the data it reads into an appropriate data types. So my character string of date, will be converted to type DATE, and similarly, seasons like Winter, Summer, Autumn, Spring will become type FACTOR. Since the data was cleaned I just plotted it using ggplot2, where I passed in years on the x-axis, and temperature on the y-axis, and applied facets on year, and colors on seasons.
Thank you!
~Mihir
Comments
Post a Comment